The AVERAGEIFS function in Microsoft Excel calculates the average of a range of numbers that meet multiple conditions. Instead of averaging all values in a column, AVERAGEIFS lets you narrow the calculation to only the data that matters, such as sales from a specific region, expenses within a date range, or scores for a particular category.
This function is especially useful when you’re working with real-world datasets that include many variables. Budgets, sales logs, time tracking sheets, inventory lists, and KPI dashboards often need conditional averages, not simple ones. AVERAGEIFS solves that problem cleanly and without helper columns.
At a high level, AVERAGEIFS answers questions like: “What is the average order value for online sales in Q2?” or “What’s the average expense amount for marketing purchases over $100?” If you’ve ever filtered data just to calculate an average, this function can save you a lot of time.
How Does the AVERAGEIFS Function Work in Excel?
AVERAGEIFS works by evaluating rows across multiple ranges at the same time. For each row, Excel checks whether all conditions are met. If they are, the value from the average range is included in the calculation. If not, it’s ignored.
All criteria ranges must be the same size as the average range. This row-by-row matching is critical and is one of the most common sources of errors for beginners. Once you understand that AVERAGEIFS is essentially applying logical tests across rows, the function becomes much easier to reason about.
Another important detail is that AVERAGEIFS ignores empty cells and text values in the average range automatically. This makes it safer for imperfect datasets where not every row is filled in.
What Is the Syntax for AVERAGEIFS in Excel?
The basic structure of the function looks like this:
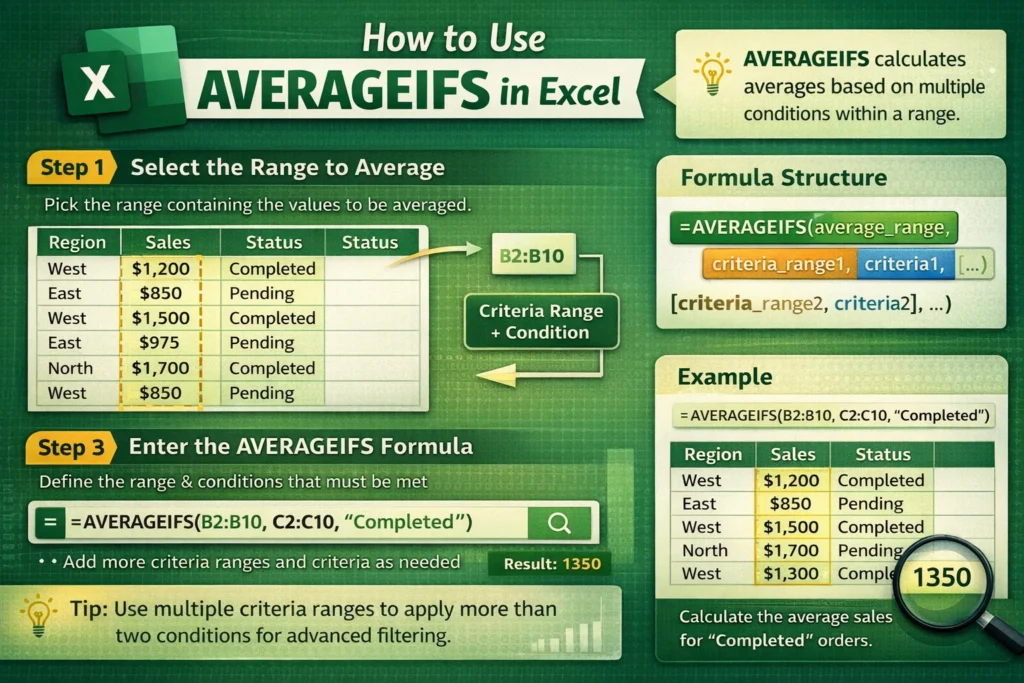
AVERAGEIFS(average_range, criteria_range1, criteria1, [criteria_range2, criteria2], …)
The average_range is the set of numbers you want to average. Each criteria_range is the column Excel checks, and each criteria is the condition that must be met. You can include multiple criteria pairs, which is what makes this function powerful.
Unlike SUMIFS or COUNTIFS, AVERAGEIFS does not allow the average_range to come after the criteria pairs. It must always be the first argument, which trips up users who are switching between functions.
AVERAGEIFS Formula Examples
AVERAGEIFS With One Condition
AVERAGEIFS(A2:A20, B2:B20, “West”)
This formula calculates the average of values in A2:A20, but only for rows where column B equals “West.” It’s commonly used for regional averages, category-based metrics, or status-based filtering.
AVERAGEIFS With Multiple Conditions
AVERAGEIFS(C2:C50, A2:A50, “Completed”, B2:B50, “>1/1/2025”)
Here, Excel averages values in column C only when the status is “Completed” and the date is after January 1, 2025. This pattern is common in project tracking, invoicing, and performance reporting.
AVERAGEIFS With Numeric Criteria
AVERAGEIFS(D2:D100, D2:D100, “>100”)
This calculates the average of values greater than 100 within the same column. While it looks redundant, this is a valid and useful pattern when excluding small or outlier values.
How Does AVERAGEIFS Compare to AVERAGEIF?
AVERAGEIF supports only one condition, while AVERAGEIFS supports multiple conditions. If you find yourself nesting formulas or using filters just to apply more than one rule, AVERAGEIFS is usually the better choice.
Another subtle difference is argument order. AVERAGEIF places the average range last, while AVERAGEIFS places it first. This inconsistency is a common source of mistakes when switching between the two.
From a performance standpoint, AVERAGEIFS is optimized for large datasets and generally performs better than combining AVERAGE with logical tests in array formulas.
What Are Common Mistakes When Using AVERAGEIFS?
One of the most frequent errors is mismatched range sizes. Every criteria range must align perfectly with the average range. If one range is shorter or starts on a different row, Excel will return an error.
Another common issue involves criteria formatting. Dates must be real date values, not text. Numeric comparisons like “>100” must be wrapped in quotes. When referencing cells in criteria, you need to concatenate operators properly, such as “>”&E1.
Users also sometimes expect AVERAGEIFS to include zeros automatically. It will include zeros if they are real numeric values, but it ignores blanks. This distinction matters when calculating averages where missing data should count as zero.
Can You Use AVERAGEIFS With Text, Dates, and Wildcards?
AVERAGEIFS supports wildcards like * and ?. This allows partial text matching, such as averaging sales where a product name starts with “Pro*”. It also works well with dates when the dates are stored correctly as numeric date values.
You can even apply date ranges using two criteria on the same date column, one for the start date and one for the end date. This technique is essential for monthly, quarterly, or custom reporting periods without helper columns.
What Are the Limitations of AVERAGEIFS in Excel?
AVERAGEIFS cannot evaluate logical OR conditions within a single formula. All criteria are treated as AND conditions. To handle OR logic, you need multiple AVERAGEIFS formulas combined or a more advanced approach using helper columns or newer Excel functions.
Another limitation is that AVERAGEIFS does not work directly across multiple worksheets unless ranges are explicitly referenced. This can make multi-sheet dashboards harder to build without restructuring data into a single table.
Finally, AVERAGEIFS is not case-sensitive. If case sensitivity matters, you’ll need alternative methods using helper columns or newer functions like FILTER combined with AVERAGE.
When Should You Use AVERAGEIFS Instead of Pivot Tables or Filters?
AVERAGEIFS is ideal when you need dynamic results that update instantly based on cell inputs, dropdowns, or changing criteria. Dashboards, calculators, and reusable templates benefit the most.
Pivot tables are better for exploratory analysis, but they’re not always ideal for embedded calculations in reports. AVERAGEIFS excels when you want clean formulas that power KPIs, summaries, and automated models without manual interaction.
On Sheetrix, many downloadable templates rely on AVERAGEIFS behind the scenes to keep summaries accurate while allowing users to customize categories, dates, and thresholds.
How Can AVERAGEIFS Improve Real-World Spreadsheet Workflows?
One underused advantage of AVERAGEIFS is combining it with data validation dropdowns to create interactive averages. For example, selecting a department or time period instantly recalculates the average without changing the formula.
Another advanced use is pairing AVERAGEIFS with structured tables. When used inside Excel tables, formulas automatically expand as new rows are added, reducing maintenance and formula errors.
Finally, AVERAGEIFS can be used defensively to exclude outliers by setting upper and lower bounds. This results in more realistic averages, especially in financial and performance datasets where extreme values can skew results.
If you’re building reports, trackers, or calculators that need accurate conditional averages, mastering AVERAGEIFS is essential. It’s one of those functions that quietly does a lot of heavy lifting once you know how to use it correctly.