Understanding Google Sheets percentile calculations can completely change how you analyze data. Instead of relying only on averages, percentiles help you see how values compare within a dataset—who’s ahead, who’s behind, and where thresholds truly lie. Whether you’re grading exams, evaluating sales performance, or analyzing response times, percentiles give you context that averages often hide.
This guide walks you through percentiles in Google Sheets step by step, explains the key functions, highlights common mistakes, and shows when to use related tools.
What Is a Percentile and Why Does It Matter in Google Sheets?
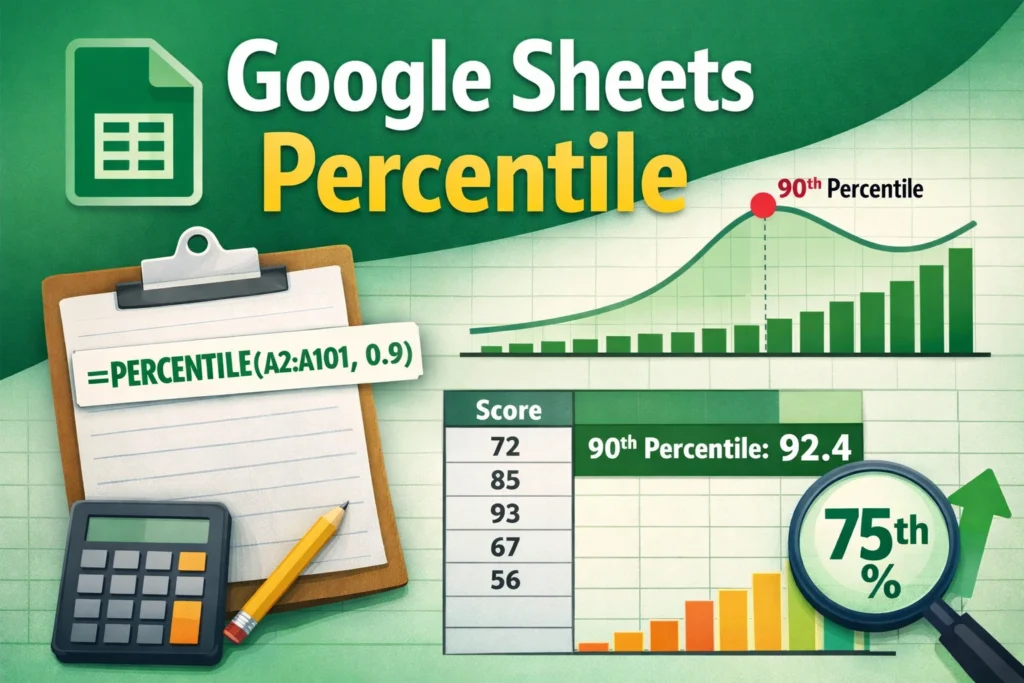
A percentile tells you the value below which a given percentage of data falls. For example, if a test score is in the 90th percentile, that score is higher than 90% of all other scores in the dataset.
In Google Sheets, percentiles are useful because they:
- Show relative performance instead of simple averages
- Help define benchmarks (top 10%, bottom 25%, median, etc.)
- Make skewed datasets easier to interpret
Percentiles are especially valuable when data isn’t evenly distributed, such as incomes, response times, or sales totals.
How Do Percentiles Work in Google Sheets?
Google Sheets calculates percentiles by sorting values from smallest to largest and determining the position of the desired percentage within that list. If the percentile falls between two values, Sheets interpolates (averages proportionally) between them.
Unlike some spreadsheet tools, Google Sheets offers two closely related percentile functions. Understanding the difference is important if you want accurate, consistent results.
Which Percentile Functions Does Google Sheets Offer?
Google Sheets provides two main functions:
PERCENTILEPERCENTILE.INC
In practice, these behave the same in Google Sheets. The platform does not support PERCENTILE.EXC, which exists in Excel. That means Google Sheets always includes the minimum and maximum values when calculating percentiles.
This limitation matters if you collaborate with Excel users or migrate files between platforms.
PERCENTILE Function Syntax Explained
The basic structure of the percentile function is simple:
Syntax:PERCENTILE(data, percentile)
- data: The range of numeric values
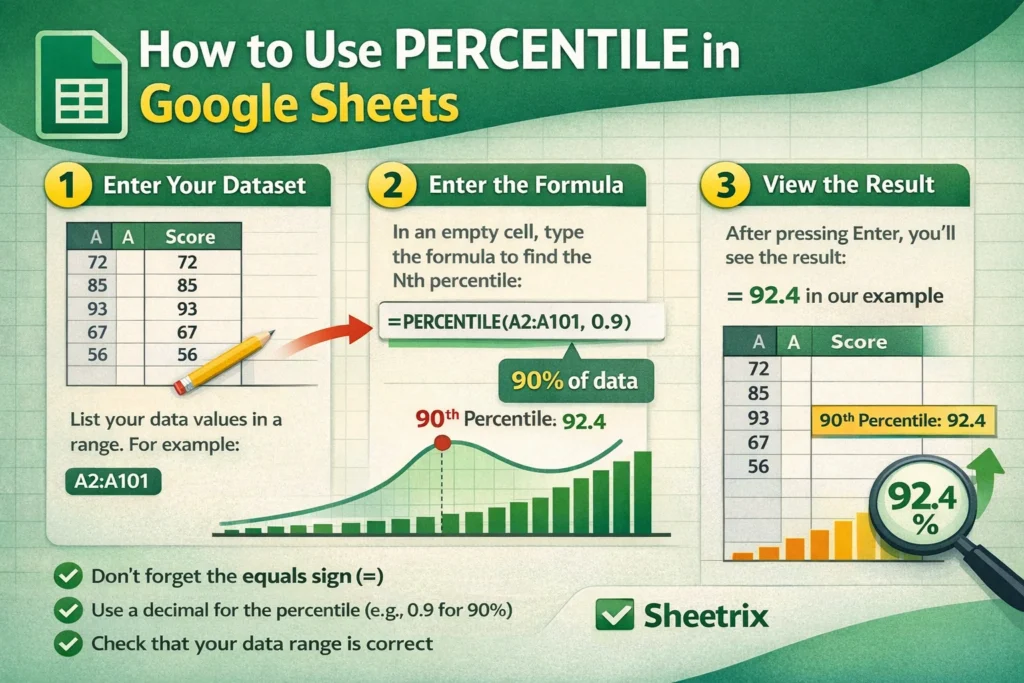
- percentile: A number between 0 and 1 (not 0–100)
For example, 0.75 represents the 75th percentile.
PERCENTILE Formula Examples
Use these examples to understand common real-world use cases.
Find the median (50th percentile):=PERCENTILE(A2:A101, 0.5)
Find the top quartile (75th percentile):=PERCENTILE(A2:A101, 0.75)
Find the bottom 10% cutoff:=PERCENTILE(A2:A101, 0.1)
A common beginner mistake is entering 75 instead of 0.75. Google Sheets will return an error if the percentile value is outside the 0–1 range.
When Should You Use Percentiles Instead of Averages?
Averages are useful, but they can be misleading when datasets contain outliers. Percentiles shine when:
- Data is skewed (income, response times, order values)
- You want ranking-based insights
- You need thresholds rather than summaries
For example, average customer support response time might look fine, but the 90th percentile may reveal that some users wait far too long.
How Can You Use Percentiles for Ranking and Benchmarks?
Percentiles are often used alongside ranking formulas. Instead of asking “Who is first?”, you can ask:
- Who is in the top 10%?
- Who falls below the 25th percentile?
- What value defines above-average performance?
By pairing percentile results with conditional formatting, you can visually highlight top and bottom performers in dashboards or reports.
What Are Common Mistakes When Using Google Sheets Percentile?
Several issues come up repeatedly:
- Using percentages instead of decimals (75 instead of 0.75)
- Including non-numeric values in the data range
- Comparing results with Excel without realizing function differences
- Assuming percentiles are rankings, not thresholds
Percentiles return a value, not a position. If you want the rank of a specific number, you’ll need a ranking or comparison formula instead.
How Is PERCENTILE Different From QUARTILE in Google Sheets?
QUARTILE is essentially a shortcut for common percentiles:
- Quartile 1 = 25th percentile
- Quartile 2 = 50th percentile (median)
- Quartile 3 = 75th percentile
While QUARTILE is convenient, PERCENTILE is more flexible because it allows any percentage, not just fixed quartiles.
Can Google Sheets Percentiles Be Used in Templates and Dashboards?
Absolutely. Percentiles are ideal for:
- Performance dashboards
- Score normalization
- Data-driven thresholds in templates
On Sheetrix, percentiles fit naturally into templates for grading, analytics, budgeting, and KPI tracking. They allow templates to adapt dynamically as data changes, instead of relying on static benchmarks.
What Should You Remember When Using Google Sheets Percentile?
Percentiles are about context, not just numbers. When used correctly, they reveal patterns that averages and totals can’t. Remember:
- Always use decimals between 0 and 1
- Expect interpolation between values
- Be aware of platform differences
- Use percentiles for comparison, not ranking positions
Once you’re comfortable with percentiles, your spreadsheets become more analytical, more flexible, and far more insightful—exactly the kind of clarity modern spreadsheet users need.