If you’ve ever worked with long lists of sales, expenses, or inventory in Google Sheets, you’ve probably needed a way to total values by category, date, or group—without building dozens of separate formulas. That’s exactly where the SUBTOTAL function shines. While many users associate it only with filtered lists, SUBTOTAL is far more powerful (and safer) than a simple SUM. This guide explains what Google Sheets SUBTOTAL really does, how it behaves differently from other functions, and when it’s the best choice for real-world spreadsheets.
What Is the Google Sheets SUBTOTAL Function?
SUBTOTAL is a special aggregation function designed for grouped or filtered data. Unlike SUM, AVERAGE, or COUNT, it can automatically ignore rows hidden by filters, filter views, or manual row hiding. This makes it ideal for dashboards, reports, and any sheet where users interact with filters. SUBTOTAL also avoids double-counting when used with other SUBTOTAL formulas, which is a common issue in summary-heavy spreadsheets.
At its core, SUBTOTAL works by pairing a numeric “function code” with a range. That code tells Sheets which calculation to perform—such as sum, count, average, min, or max—and whether to include or exclude hidden rows.
When Should You Use SUBTOTAL Instead of SUM?
SUBTOTAL is the better option whenever your totals should change based on what’s visible on the sheet. For example, if you filter a sales table to show only one region, a SUM formula will still add all rows unless you adjust the range. SUBTOTAL recalculates automatically to reflect only visible rows. It’s also safer in structured reports where subtotals feed into higher-level totals, because SUBTOTAL formulas intentionally ignore other SUBTOTAL results to prevent duplication.
That said, SUBTOTAL is not meant for conditional logic. If you need totals based on criteria like category names or date ranges without filtering, functions like SUMIF or SUMIFS are more appropriate.
How Does SUBTOTAL Handle Filters and Hidden Rows?
One of the most misunderstood aspects of SUBTOTAL is how it treats hidden data. The behavior depends entirely on the function code you use. Codes from 1–11 include manually hidden rows but exclude filtered rows. Codes from 101–111 exclude both filtered rows and manually hidden rows. This distinction matters in shared spreadsheets where users might hide rows without applying filters.
For example, a dashboard that relies on filter views should almost always use the 100-series codes to ensure totals reflect only what’s visible to the viewer. This subtle difference is rarely explained in basic tutorials but can prevent major reporting errors.
Google Sheets SUBTOTAL Formula Examples
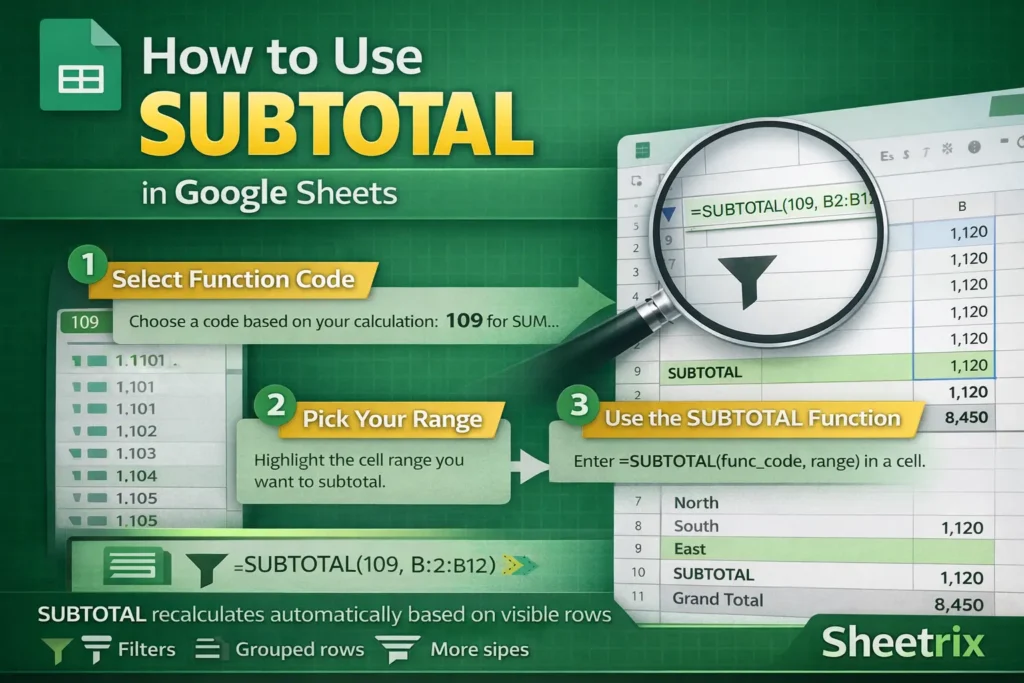
Below are the most common and practical SUBTOTAL formulas. Use these as patterns rather than memorizing every code.
SUM Subtotal (Most Common)
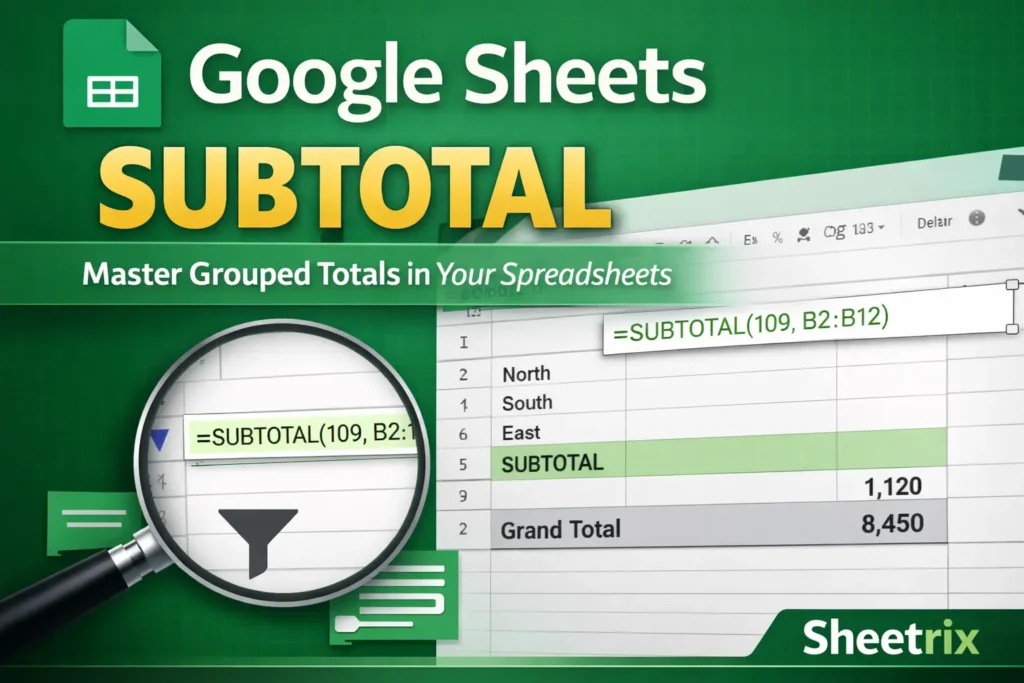
=SUBTOTAL(109, B2:B100)This sums only visible values in B2:B100, ignoring filtered and manually hidden rows.
COUNT Subtotal
=SUBTOTAL(103, A2:A100)Counts non-empty visible cells in the range. Useful for tracking how many records remain after filtering.
AVERAGE Subtotal
=SUBTOTAL(101, C2:C100)Calculates the average of visible values only, excluding all hidden rows.
MIN or MAX Subtotal
=SUBTOTAL(105, D2:D100)
=SUBTOTAL(104, D2:D100)
Returns the minimum or maximum visible value in a filtered dataset.
Can SUBTOTAL Be Used in Grouped Reports?
Yes—and this is one of its most powerful use cases. SUBTOTAL works extremely well with grouped rows created using Google Sheets’ “Group rows” feature. When you collapse groups, SUBTOTAL automatically updates based on what remains visible. This allows you to build expandable financial statements, category rollups, or monthly summaries without writing complex formulas.
A key advantage here is that you can place SUBTOTAL formulas at the top or bottom of each group, then use another SUBTOTAL to calculate a grand total without worrying about double-counting intermediate totals.
What Are Common Mistakes People Make with SUBTOTAL?
One frequent mistake is using the wrong function code. Many users default to code 9 (SUM) without realizing it includes manually hidden rows. Another issue is trying to combine SUBTOTAL with array-based logic like ARRAYFORMULA or conditional criteria. SUBTOTAL does not evaluate conditions—it only reacts to visibility.
Another subtle pitfall is copying SUBTOTAL formulas into filtered ranges without anchoring ranges correctly. Because SUBTOTAL recalculates dynamically, inconsistent ranges can lead to totals that appear “wrong” when filters change.
How Does SUBTOTAL Compare to SUMIF and SUMIFS?
SUBTOTAL and SUMIFS solve different problems. SUBTOTAL is visibility-aware, while SUMIFS is criteria-aware. If your workflow relies on filters or interactive views, SUBTOTAL is the right choice. If your totals depend on conditions like “Category = Rent” or “Date is in January,” SUMIFS is more appropriate.
An advanced but underused technique is combining filters for user interaction with helper columns that drive SUMIFS elsewhere. This gives you both visibility-based reporting and criteria-based summaries in the same spreadsheet.
Are There Any Limitations to Google Sheets SUBTOTAL?
SUBTOTAL cannot evaluate text-based conditions, and it cannot be nested inside array formulas for row-by-row calculations. It also doesn’t work across multiple non-contiguous ranges in a single formula. Additionally, unlike QUERY, it doesn’t create grouped results automatically—you must structure your data or row groups first.
A lesser-known limitation is that SUBTOTAL ignores rows hidden by conditional formatting-based scripts but does not respond to custom Apps Script visibility changes unless they truly hide rows.
Why SUBTOTAL Is Essential for Dashboards and Templates
For templates that users customize—like expense trackers, sales logs, or inventory lists—SUBTOTAL is often the safest default. It respects filters, prevents double-counting, and requires minimal explanation for end users. That’s why many professional Google Sheets templates rely on SUBTOTAL instead of SUM for summary rows.
If you’re building reusable spreadsheets or downloadable templates, SUBTOTAL helps ensure totals remain accurate no matter how users sort, filter, or collapse the data.
Final Thoughts
Google Sheets SUBTOTAL is more than a filtered SUM—it’s a visibility-aware aggregation tool designed for real-world reporting. By understanding how function codes work, when to use the 100-series options, and how SUBTOTAL interacts with grouped data, you can build spreadsheets that stay accurate under almost any user interaction. If your reports depend on filters, expandable sections, or dynamic views, SUBTOTAL should be one of the first functions you reach for.