If you are searching for a reliable blood pressure log in Google Sheets, this template is built specifically for that purpose. It is designed to help you record daily readings, automatically categorize them, and review clear summaries without complicated setup.
Many printable logs simply collect numbers. This Google Sheets blood pressure log goes further by turning your readings into organized insights. As soon as you enter your systolic and diastolic values, the sheet classifies the reading, updates averages, and reflects changes on the dashboard automatically.
Because it is built in Google Sheets, you can access it from any device with internet access. That means you can log a reading from your phone, review trends on your laptop, or share the sheet with a family member. Everything stays synced and updated in real time.
This blood pressure log is ideal for:
- Individuals managing high blood pressure
- Patients monitoring new medication
- People tracking both high and low readings
- Caregivers helping parents or grandparents
- Anyone preparing organized data for a doctor visit
The focus is simple: make tracking easy, accurate, and useful over the long term.
Key Features and Sections
This Google Sheets blood pressure log includes three organized sheets that work together: the main log, a dashboard, and a settings page. Each part is built to keep the workflow simple while delivering meaningful summaries.
Blood Pressure Log Sheet
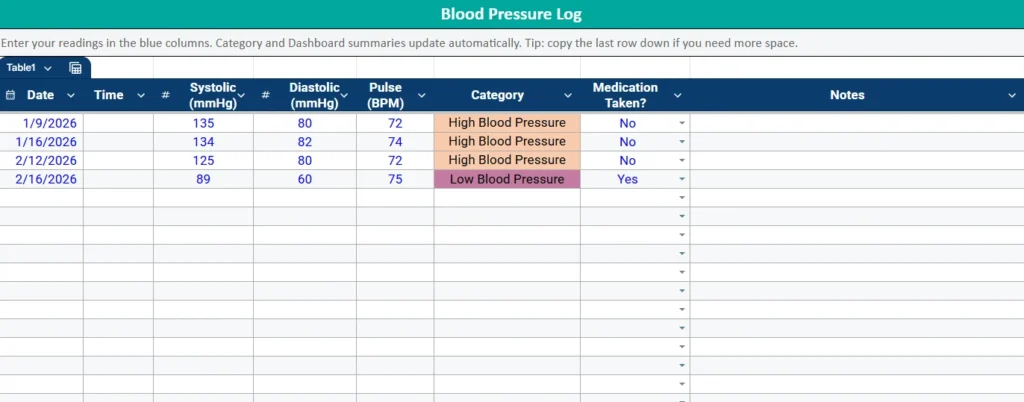
The main sheet is where you enter your readings. The layout includes:
- Date
- Time
- Systolic (mmHg)
- Diastolic (mmHg)
- Pulse (BPM)
- Category
- Medication Taken?
- Notes
You only type in the input columns. The Category column is handled automatically by formulas inside Google Sheets. As soon as systolic and diastolic values are entered, the sheet classifies the reading using defined thresholds.
Readings are categorized as:
- Normal
- Elevated
- High Blood Pressure (Stage 1)
- High Blood Pressure (Stage 2)
- Hypertensive Crisis
- Low Blood Pressure
The addition of Low Blood Pressure makes this log more complete. If systolic drops below 90 or diastolic drops below 60, the sheet clearly flags it. This is helpful for individuals who experience dizziness, medication side effects, or naturally lower readings.
Conditional formatting in Google Sheets highlights each category using distinct colors. This visual cue allows you to scan the log quickly and spot trends without analyzing every number.
The Medication Taken column uses a dropdown menu. By selecting Yes or No, you create consistent entries that the dashboard can summarize later. Over time, you can see whether readings improve with consistent medication use.
The Notes column allows you to add context, such as:
- Before coffee
- After exercise
- Feeling stressed
- New prescription started
These small details often explain variations in readings and can be useful during medical appointments.
Dashboard Sheet
The Dashboard sheet is where Google Sheets becomes especially powerful. Instead of reviewing dozens of rows manually, you get automatic summaries.
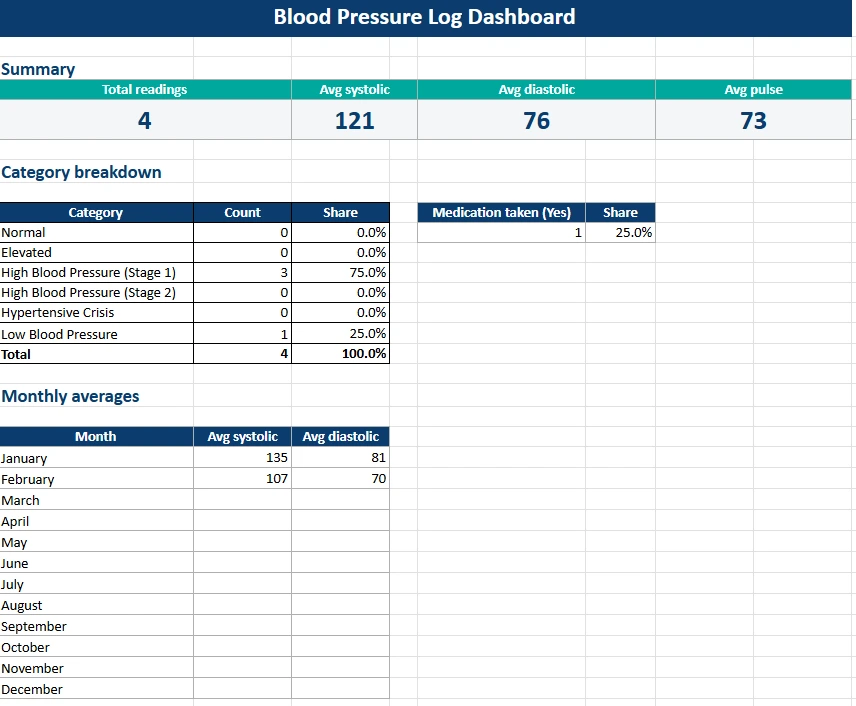
At the top of the dashboard, you will see:
- Total readings
- Average systolic
- Average diastolic
- Average pulse
These metrics update instantly as you add new entries to the blood pressure log.
Below that, the Category Breakdown section shows how many readings fall into each classification. You can quickly determine whether most readings are Normal, Stage 1, or Low Blood Pressure.
There is also a Medication Taken summary that shows the share of readings marked Yes. This can help you evaluate consistency and discuss adherence with a healthcare provider.
The Monthly Averages table provides an even broader perspective. Instead of focusing on individual days, you can review average systolic and diastolic values by month. This is especially useful if you are tracking lifestyle changes, diet adjustments, or medication updates.
Because everything is formula-driven inside Google Sheets, you never have to update calculations manually. The dashboard responds automatically as your data grows.
Settings Sheet
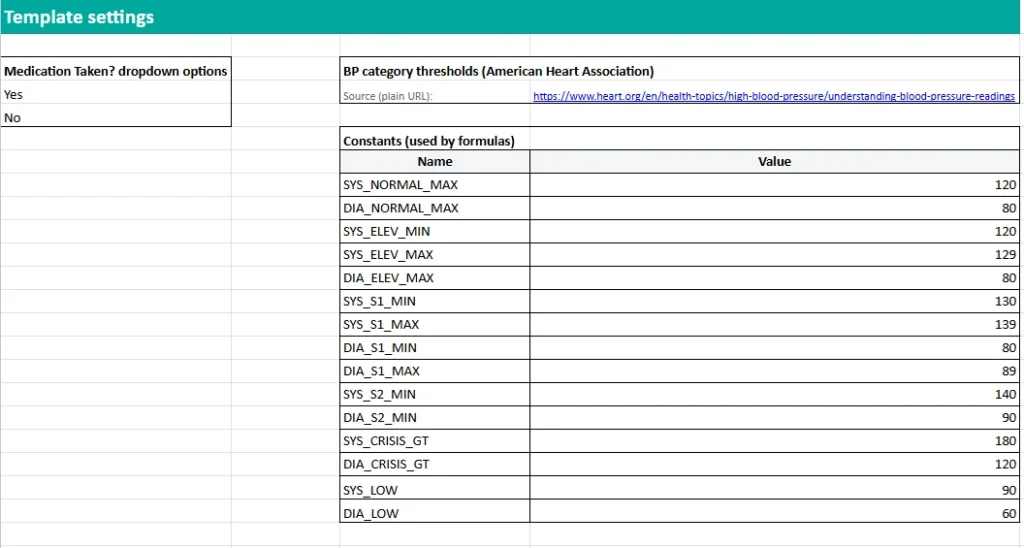
The Settings sheet keeps the template flexible and transparent.
The first section contains the dropdown options for the Medication column. These options feed directly into the main log through data validation, ensuring clean and consistent entries.
The second section lists blood pressure category thresholds. Instead of hardcoding numbers into complex formulas, this Google Sheets template uses named ranges such as SYS_NORMAL_MAX, SYS_S1_MIN, SYS_S2_MIN, SYS_LOW, and DIA_LOW.
This design makes the sheet easier to maintain. If medical guidance changes or your doctor recommends slightly different thresholds, you can adjust the values in one place and the entire sheet updates automatically.
Using named ranges inside Google Sheets improves clarity and keeps the formulas readable and organized.
How to Use the Template
To begin, open the Google Sheets blood pressure log and start entering your readings in a new row each time you measure your blood pressure.
First, enter the Date and Time. Then record your systolic and diastolic numbers exactly as displayed on your monitor. Enter your pulse if available.
Once you type in systolic and diastolic values, Google Sheets automatically determines the correct category. You do not need to remember specific ranges.
Next, select Yes or No in the Medication Taken dropdown. This keeps the data structured and prevents inconsistent entries.
Add any relevant context in the Notes column. For example:
- Morning reading before breakfast
- Evening reading after work
- Felt lightheaded
- Skipped medication yesterday
After you have several days or weeks of data, switch to the Dashboard sheet. Review your averages and category distribution. Look for patterns instead of reacting to a single high or low reading.
If you are preparing for a medical appointment, the Dashboard provides a concise summary that is much easier to discuss than handwritten notes. You can even filter by month within Google Sheets if you want to focus on a specific timeframe.
To extend the sheet, simply add additional rows. The formulas and summaries continue working automatically without extra configuration.
Why Choose This Template
There are many printable blood pressure charts online, but most of them stop at basic record keeping. This Google Sheets blood pressure log is designed to do more.
First, it removes guesswork. The sheet automatically categorizes each reading using clearly defined thresholds.
Second, it accounts for both high and low blood pressure. Many logs focus only on hypertension, but low readings can also be important. This template tracks both.
Third, it provides meaningful summaries. Instead of manually calculating averages, Google Sheets handles everything instantly.
Fourth, it is cloud-based. You can:
- Access your blood pressure log from any device
- Share it with a caregiver
- Keep your data backed up automatically
- Continue tracking long term without printing new pages
Finally, it is clean and professional. The structure is simple, the dashboard is easy to interpret, and the formulas are built with transparency in mind.
If you want a structured, automated, and easy-to-use blood pressure log in Google Sheets, this template provides everything you need to start tracking immediately. Download your copy, begin recording your readings, and turn daily numbers into clear, organized insights that support better health decisions.
Get Your Free Blood Pressure Log Spreadsheet
- Free Template
- Fully Editable
- Instant Access
- Organize your information
How to Access Your Copy
- Enter your email for instant access
- Open the link we send you
- Start using the spreadsheet right away