If you are planning a renovation, the hardest part is not picking tile or paint, it is keeping your numbers realistic as quotes, deposits, and surprise costs roll in. This Home Remodel Budget Template is built for Google Sheets (and also works in Excel) so you can track estimated vs. actual costs, keep vendor payments organized, and see your budget health at a glance on a dashboard. The spreadsheet is designed around a simple workflow: enter line items as you get quotes and receipts, and everything else updates automatically, including category totals, phase totals, “over budget” flags, and charts.
What’s included in this home remodel budget template?
This template uses a clean structure with a guided setup page, a detailed expenses table, auto-generated summaries, and a vendor tracker that helps you stay ahead of due dates and balances. A few upgrades make it feel “done” right away: dropdowns for consistent data entry, a bar chart (instead of a column chart) for easier category comparison, and a “Cost Used in Totals” approach that keeps your dashboard accurate even when some items are still estimates.
Start Here sheet
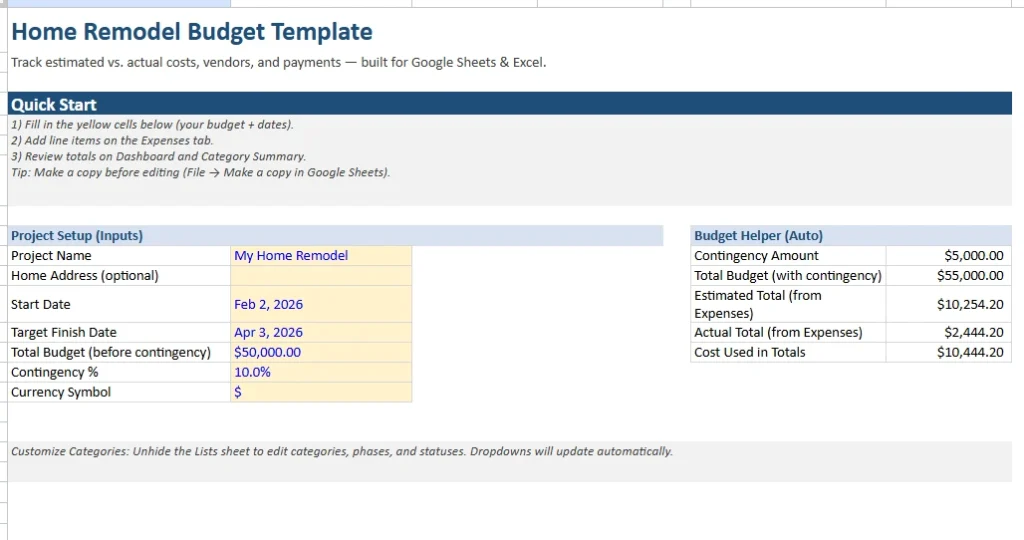
The Start Here page is your control center. It includes a Quick Start checklist so users know exactly what to do first, without hunting through tabs. In the Project Setup (Inputs) area, you enter the basics: project name, optional address, start date, target finish date, total budget (before contingency), contingency percent, and currency symbol. These inputs feed the rest of the workbook so the dashboard totals make sense from day one. On the right, the Budget Helper (Auto) section calculates the contingency amount and your total budget with contingency included. It also pulls totals from the Expenses sheet, including the Estimated Total, Actual Total, and the all-important Cost Used in Totals number that the dashboard relies on. This keeps the spreadsheet useful at every stage, whether you are still collecting quotes or already paying invoices.
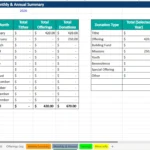
Dashboard sheet
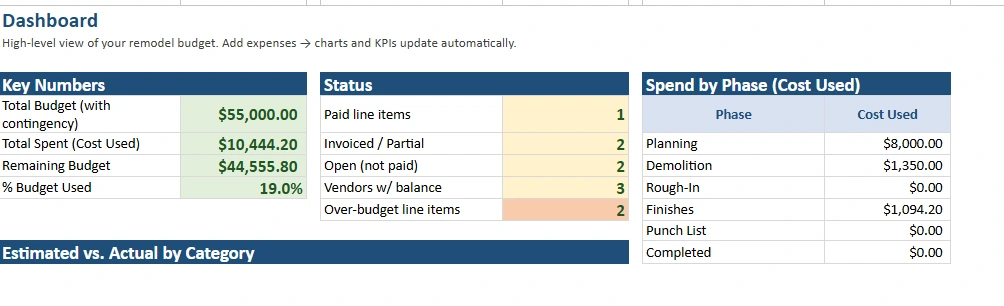
The Dashboard gives a high-level view of your remodel budget, updated automatically as you add expenses. The Key Numbers panel shows Total Budget (with contingency), Total Spent (Cost Used), Remaining Budget, and Percent Budget Used. That “Cost Used” number matters because remodel projects often include a mix of planned costs and confirmed costs. The Status panel adds a quick layer of project management: it counts paid line items, invoiced or partially paid items, open (not paid) items, vendors with a balance, and over-budget line items. This is especially helpful if you are juggling multiple trades and trying to understand what is still outstanding. The Spend by Phase (Cost Used) table makes it easy to spot which stage is consuming your budget, like Planning, Demolition, Rough-In, Finishes, Punch List, and Completed.
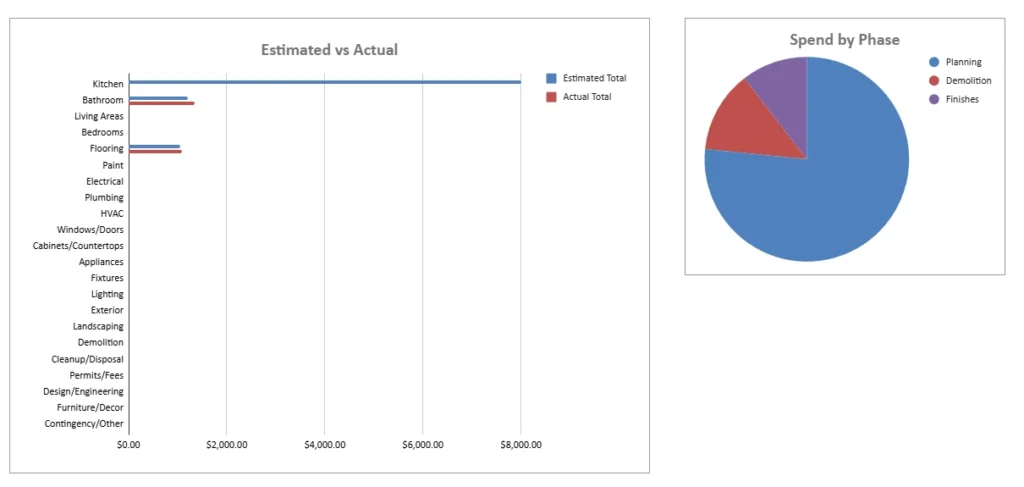
Finally, the Estimated vs Actual by Category is a horizontal bar chart, which makes long category lists easier to read.
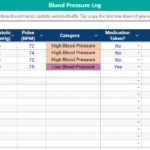
Expenses sheet
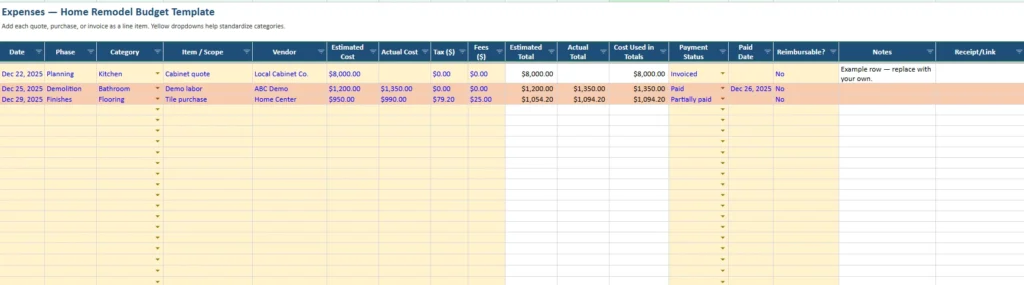
The Expenses tab is where the work happens. Each row is a line item, which could be a quote, purchase, invoice, delivery fee, permit, or even a refundable deposit. The columns are set up to keep entry fast while still capturing the details that affect your totals. You have Date, Phase, Category, Item/Scope, Vendor, Estimated Cost, Actual Cost, Tax, Fees, Estimated Total, Actual Total, Cost Used in Totals, Payment Status, Paid Date, Reimbursable?, Notes, and Receipt/Link. The dropdowns you added for Phase, Category, Payment Status, and Reimbursable help standardize data entry so summaries stay accurate. For example, if one row says “Partially paid” and another says “Partial,” your counts and filters get messy. Dropdowns prevent that. A key feature here is how the totals behave: Estimated Total and Actual Total allow tax and fees to be included, which is where many budgets go wrong. People track the base cost but forget delivery, disposal, credit card fees, or sales tax. The Cost Used in Totals column solves the “some estimates, some actuals” problem by using the actual total when it exists, otherwise it falls back to the estimate. That means your dashboard stays realistic throughout the project, not just at the end.
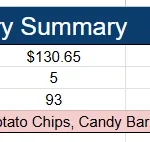
Category Summary sheet
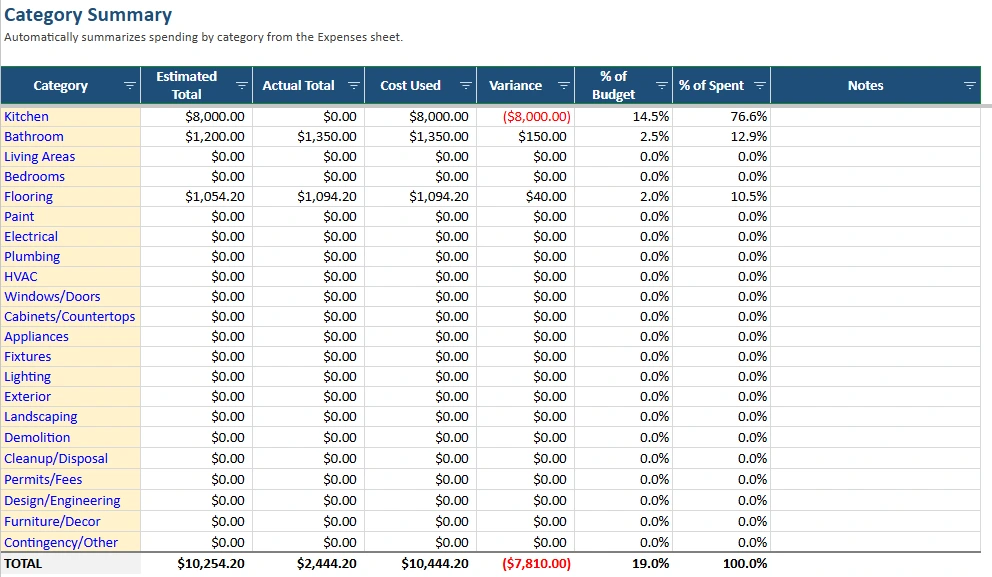
The Category Summary automatically aggregates spending by category from the Expenses table. It includes Estimated Total, Actual Total, Cost Used, Variance, Percent of Budget, and Percent of Spent. This view is useful because categories are where budgets quietly drift. You might be on track overall, but your kitchen cabinetry could be eating the entire contingency while other categories are untouched. The Variance column quickly flags overspending, and the Percent of Budget column helps you understand proportional impact. Percent of Spent is also helpful as your project grows because it shows which categories are dominating your total spend, even if they are not technically “over” their estimates yet. This is a great tab for people who want to negotiate scope changes or decide where to downgrade finishes to protect the overall budget.
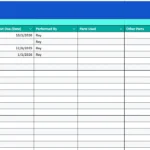
Vendors & Payments sheet
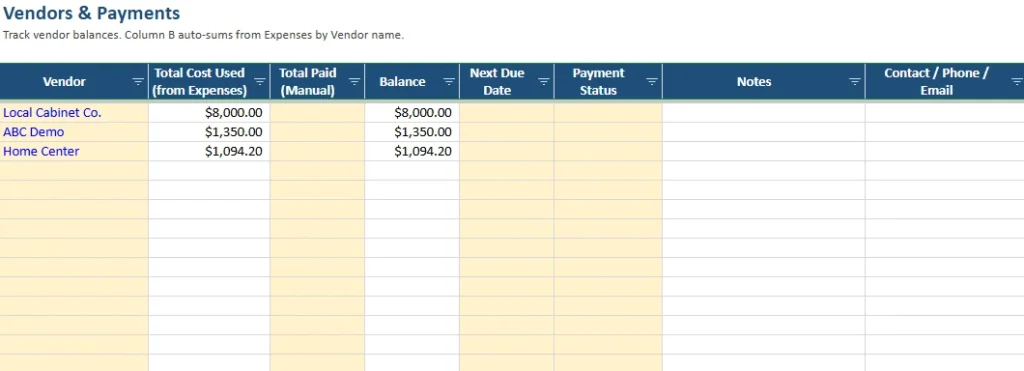
The Vendors & Payments tab is built for real remodel logistics. You may have a cabinet company, a demo crew, a flooring supplier, a general contractor, and a handful of specialty trades. This sheet tracks each vendor, the Total Cost Used pulled from Expenses by vendor name, a Total Paid field you can enter manually, and an auto-calculated Balance. It also includes Next Due Date, Payment Status, Notes, and Contact/Phone/Email. The balance view is useful even if you do not have perfect invoice tracking, because it tells you who still has money outstanding and how much. It also helps avoid missed payments when due dates are scattered across text messages and emails.
How do you use the template step by step?
Start on the Start Here tab and fill in the yellow input cells. Enter your total budget before contingency and choose a contingency percent that fits your risk level. Many homeowners use 10% as a starting point, but older homes or major structural work may justify more. Next, go to the Expenses sheet and begin adding line items. A good approach is to enter estimates as soon as you get quotes, even if you have not committed yet, because that gives you an early warning if your plan is already over budget. Use the Phase and Category dropdowns consistently so the dashboard and summaries stay clean. As you start paying, update Actual Cost, Tax, Fees, and Payment Status. If you partially pay a vendor, set Payment Status to “Partially paid” so the Status panel counts it correctly. Add receipts or invoice links in the Receipt/Link column so the spreadsheet becomes a lightweight audit trail you can reference later. Then review the Dashboard after each batch of updates. If Remaining Budget is shrinking faster than expected, the Spend by Phase table can tell you whether it is a timing issue (big early deposits) or a real scope issue. Finally, use the Category Summary to make decisions. If one category is over, you can either reduce scope elsewhere or accept that your contingency is being used earlier than planned.
Here is a realistic example workflow: you enter a cabinet quote as an estimate, then later replace it with the invoice amount once you pay the deposit. The template automatically switches the Cost Used in Totals from estimate-based to actual-based for that line item, so your dashboard reflects the new reality without you having to rework any totals. Another example is flooring: you might estimate materials only, then later add delivery fees and tax. Because the sheet separates base cost from tax and fees, your totals remain accurate and you can see exactly what pushed the final amount higher.
Why choose this home remodel budget template instead of a basic spreadsheet?
A basic remodel budget sheet usually fails in three places: it does not handle estimates vs actuals gracefully, it does not track payment status cleanly, and it does not summarize the project in a way that supports decisions. This template solves those issues with a practical structure and a few “real world” touches that matter. The dropdowns keep your data consistent so your charts and counts stay correct. The bar chart makes category comparisons easier when you have many categories, which is common in whole-home projects. The Cost Used in Totals method is the biggest upgrade because it gives you a single reliable number for “what am I really spending” at any moment in the project, even when half your items are still quotes. The vendor tracker adds a layer most homeowners end up building mid-project anyway, usually after a missed invoice or a confusing payment thread. With this template, that layer is already built in.
If you are a homeowner doing a kitchen remodel, this helps you avoid overspending on cabinetry and appliances before you have priced electrical and plumbing. If you are managing a bathroom refresh, it helps you track tile, labor, fixtures, permits, and disposal as separate line items so you can see what is driving costs. If you are a landlord or small investor doing multiple units, it gives you repeatable structure and a fast way to compare budgets across projects. And if you are working with a contractor, it helps you have clearer conversations because you can point to phases, categories, and payment status instead of relying on memory.
Get Your Free Home Remodel Budget Spreadsheet
- Free Template
- Fully Editable
- Instant Access
- Organize your information
How to Access Your Copy
- Enter your email for instant access
- Open the link we send you
- Start using the spreadsheet right away