Running a business means keeping track of dozens of moving parts — clients, sales reps, payments, and performance goals. It’s easy for numbers to slip through the cracks if you don’t have a simple yet effective system in place. That’s exactly what the Sales Tracker Spreadsheet from Sheetrix is designed to do.
Built in Google Sheets, this template makes it easy to log sales, analyze performance, and visualize revenue trends all in one place. It’s ideal for small business owners, freelancers, or sales teams who want a simple, data-driven way to stay organized without investing in expensive software.
A Simple Way to Manage and Understand Your Sales
The Sales Tracker Spreadsheet brings structure and clarity to your sales process. Instead of using scattered sheets or handwritten notes, you’ll have one organized system that automatically updates totals and charts.
The spreadsheet is made up of five connected sheets that work together to track your data from every angle — by product, by salesperson, and by time period. Everything is automated, so you can focus on your customers instead of your calculations.
You don’t need to know complex formulas or dashboards. All the logic is already built in — simply enter your sales, and the summaries update instantly.
Explore What’s Inside the Template
This free sales tracker includes five fully linked sheets. Each one serves a specific purpose but connects to the others for a complete overview of your sales activity.
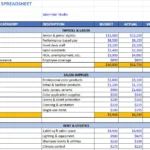
Sales Entries Sheet
This is the core of your sales tracking system — the place where all your data begins.
Every sale you make should be logged here, with the following columns:
- Date – The day the sale occurred.
- Sales Rep – Chosen from a dropdown list of your team members.
- Customer Name – The name of your client or account.
- Product / Service – Selected from your list of offerings.
- Quantity and Unit Price – Used to automatically calculate total sales value.
- Payment Status – Choose “Paid,” “Pending,” or “Overdue.”
- Notes – Add any helpful comments such as “repeat customer” or “follow-up next week.”
Each new entry automatically updates totals throughout the file. The sheet uses conditional formatting to color-code payment statuses, helping you spot overdue invoices or pending payments immediately. Green means “Paid,” yellow means “Pending,” and red flags overdue transactions.
For example, if a rep named Sarah Lee closes three deals in October — two paid and one pending — her sales automatically flow into the monthly revenue chart, the product performance summary, and her personal stats in the Rep Performance sheet.
Overall Sales Sheet
The Overall Sales sheet provides a clear view of your company’s monthly revenue.
It includes two main sections:
- A monthly table showing total revenue for each month of the year.
- A bar chart that visualizes trends automatically as you add new sales data.
This sheet is especially helpful for business owners who want to see patterns over time. You can easily identify slow months, seasonal peaks, or areas where new strategies are paying off.
For example, if your August and October numbers spike while other months are flat, you can adjust marketing campaigns to target those higher-performing periods.
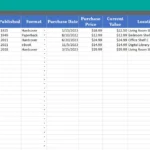
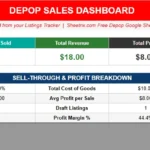
Product Sales Sheet
The Product Sales tab gives you a breakdown of revenue per product or service.
It has two main columns:
- Current Month Revenue – Shows total sales for the selected month.
- Lifetime Revenue – Tracks cumulative totals from all months combined.
At the top, a month selector lets you choose any month, and the charts below update instantly. Two charts make it easy to compare:
- A bar chart for lifetime sales that highlights which product generates the most revenue overall.
- Another chart for current month sales to monitor short-term performance.
This view helps you understand which offerings drive your income. For example, if “Service B” consistently outperforms others, you can focus on upselling it or introducing complementary services.
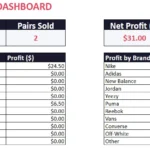
Rep Performance Sheet
If you manage a sales team, this is the sheet you’ll check most often.
Each sales representative’s performance is summarized in two key ways:
- Monthly Revenue – The total they’ve earned during the selected month.
- Lifetime Revenue – Their cumulative total across all time.
Two side-by-side charts visualize the results:
- A bar chart comparing each rep’s lifetime performance.
- A smaller chart highlighting the selected month’s achievements.
This view makes performance reviews easier and more objective. Managers can identify top performers, set fair commission targets, or provide extra training where needed.
Even solo entrepreneurs benefit from this tab — it’s a great way to track your own consistency and set realistic growth goals.
Dropdown Lists Sheet
This behind-the-scenes tab powers all the dropdown menus throughout the template. It contains:
- A list of Sales Agents
- A list of Products / Services
- A list of Payment Statuses
- Auto-calculated Months and Years
You can easily customize these lists. If you hire a new salesperson or add a new product, simply update this sheet — your dropdown menus update automatically across the file.
A note reminds users not to modify the months and years section, since those are formula-driven fields used by other sheets for reports.
How to Use the Sales Tracker Spreadsheet
One of the best things about this template is its simplicity. You don’t need any advanced Excel or Sheets knowledge to get started.
Step 1: Make Your Copy
Open the template in Google Sheets and choose File → Make a copy to save it to your account.
Step 2: Add Your Team and Products
Go to the Dropdown Lists sheet to enter your sales reps, products, and payment types.
Step 3: Record Your Sales
Start entering data on the Sales Entries sheet. Each sale updates totals and charts automatically.
Step 4: Review Your Performance
Switch between tabs to view your overall monthly totals, product performance, and rep comparisons. The charts will update instantly whenever you change or add data.
Step 5: Keep It Updated
The more consistently you log your sales, the more valuable your reports become. Even small businesses can discover patterns that drive smarter decisions — like which months bring in the most revenue or which services are underperforming.
For example, a freelancer tracking projects might notice that consulting gigs spike every September. With that insight, they can plan promotions or adjust pricing around that period.
Why This Spreadsheet is a Game Changer
Unlike generic templates that require heavy editing, this one is fully structured and ready to use. It’s perfect for:
- Small business owners who want clear visibility into sales trends.
- Freelancers or consultants managing multiple clients or services.
- Sales managers overseeing team performance and commissions.
- Startups tracking product launches or revenue growth.
What sets this template apart is its balance between simplicity and insight. It automates calculations, uses dropdowns to avoid entry errors, and provides built-in charts that make your data visual and easy to interpret.
You can also expand it as your business grows — add more columns, create new categories, or link it to Google Forms for automated data entry. The foundation is flexible enough to scale with you.
Get Your Free Sales Tracker Spreadsheet
- Free Template
- Fully Editable
- Instant Access
- Organize your information
How to Access Your Copy
- Enter your email for instant access
- Open the link we send you
- Start using the spreadsheet right away
Use it to stay organized, understand your business better, and make smarter sales decisions every day.