Running a snack bar sounds simple until you start tracking what is actually on the shelves. Chips disappear faster than expected. Drinks sell out before game day ends. Candy bars sit longer than you thought. Without a clear system, it becomes guesswork.
This Snack Bar Inventory Spreadsheet was built specifically for small snack bars, concession stands, school snack counters, church events, and gym cafés that need a clean and reliable way to manage stock. It combines a clear summary section with a structured inventory table, all inside one primary sheet. A second sheet handles dropdown lists so your data stays organized and consistent.
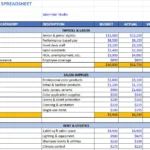
The main sheet gives you an at-a-glance view of:
- Total inventory value
- Total SKUs
- Total items in stock
- Items below par level
Directly below that summary is a detailed inventory entry table where you track cost, pricing, stock levels, and reorder thresholds. Everything updates automatically as you enter data.
This template is designed to be practical. It avoids unnecessary complexity while still giving you meaningful business insights like profit per unit and restock alerts. Whether you run a small after-school snack bar or a busy weekend concession stand, this spreadsheet keeps your inventory under control.
Key Features and Sections
Inventory & Summary Sheet
The first sheet combines two critical areas: the summary dashboard at the top and the full inventory table below.
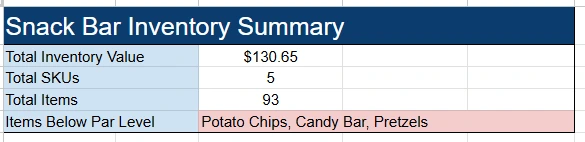
The summary section includes:
- Total Inventory Value
- Total SKUs
- Total Items
- Items Below Par Level
Total Inventory Value automatically calculates the combined value of your current stock using the Total Value column in the table. This gives you immediate visibility into how much money is tied up in inventory.
Total SKUs counts the unique products you are tracking. If you add a new flavor of chips or introduce a new protein bar, that number updates automatically.
Total Items reflects your total quantity across all products. This is helpful for understanding how much physical inventory you are managing.
Items Below Par Level dynamically lists products that need attention. For example, if Potato Chips, Candy Bars, and Pretzels fall below their set par levels, they appear in this field. Instead of scanning the entire table, you can instantly see what needs reordering.
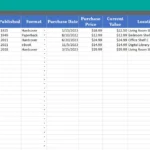
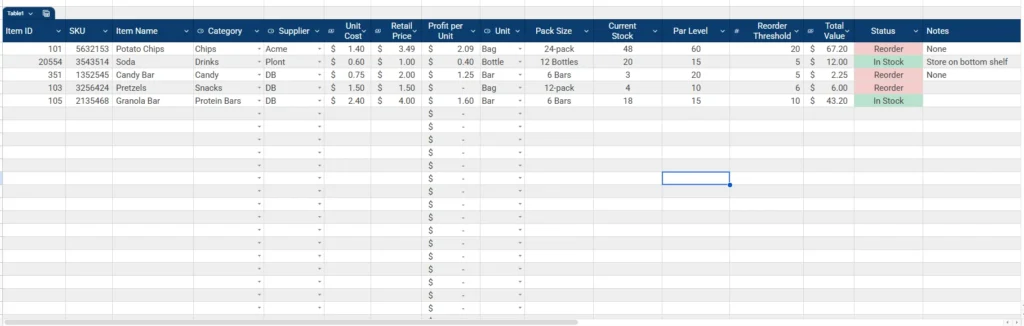
Below the summary is the structured inventory table with the following columns:
- Item ID
- SKU
- Item Name
- Category
- Supplier
- Unit Cost
- Retail Price
- Profit per Unit
- Unit
- Pack Size
- Current Stock
- Par Level
- Reorder Threshold
- Total Value
- Status
- Notes
Each column plays a specific role in helping snack bar operators stay organized.
Unit Cost and Retail Price allow you to automatically calculate Profit per Unit. This is critical. Many small snack operations do not consistently measure margin. With this spreadsheet, you can immediately see that a $0.75 candy bar sold at $2.00 generates $1.25 in profit per unit.
Total Value multiplies Unit Cost by Current Stock. This feeds into your top summary and gives you a live valuation of your inventory.
Par Level represents your ideal minimum stock target. Reorder Threshold is your buffer point. When Current Stock drops below the threshold, the Status column changes to Reorder using conditional logic. This visual cue helps prevent stockouts during busy periods.
Dropdown Lists Sheet
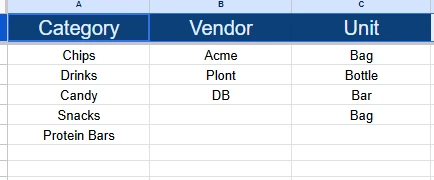
The second sheet contains your dropdown lists. This keeps your data clean and prevents inconsistent entries.
It includes structured lists for:
- Category
- Vendor
- Unit
For example, categories include Chips, Drinks, Candy, Snacks, and Protein Bars. Vendors such as Acme, Plont, and DB can be selected instead of manually typed each time. Units like Bag, Bottle, and Bar ensure consistent formatting across the table.
This separation is intentional. When you need to add a new category such as Ice Cream or Popcorn, you update it once in the Dropdowns sheet and it becomes available everywhere in the inventory table.
This structure keeps the main sheet simple while maintaining flexibility.
How to Use the Template
Start by customizing the Dropdown Lists sheet. Add your real vendors, adjust product categories, and confirm the units you use most often. This ensures your inventory entries stay consistent.
Next, move to the main Inventory & Summary sheet and begin entering your products.
Enter a unique Item ID and SKU for each product. The SKU can match your supplier code or internal tracking number. Then input:
- Item Name
- Category from dropdown
- Supplier from dropdown
- Unit Cost
- Retail Price
- Unit
- Pack Size
Once you enter Unit Cost and Retail Price, Profit per Unit calculates automatically. This helps you quickly identify which products generate the strongest margins. For example, you may discover that protein bars generate higher profit per unit than soda.
Enter Current Stock to reflect how many individual units you currently have. Then define your Par Level and Reorder Threshold.
For example, if you want to always have 60 bags of chips available, set Par Level to 60. If you want to trigger a reorder when stock drops to 20, set Reorder Threshold to 20. When Current Stock reaches or drops below 20, the Status column updates to Reorder.
The Total Value column multiplies Unit Cost by Current Stock. This feeds directly into the summary section at the top.
Over time, you can review your Status column to identify patterns. If certain products frequently hit Reorder status, you may need to increase par levels. If others rarely move, you may consider reducing stock levels to free up cash.
The Notes column gives you flexibility. You might record storage instructions, shelf placement details, or supplier notes such as “Store on bottom shelf” or “Seasonal item.”
This structure works especially well for:
- School snack bars managing limited weekly budgets
- Church concession stands preparing for weekend services
- Gym cafés tracking protein snacks and drinks
- Community sports leagues running event-based sales
Everything is designed so that even someone with basic spreadsheet knowledge can maintain it consistently.
Why Choose This Template
Many inventory spreadsheets are either too generic or too complicated. This one is purpose-built for snack bar operations.
First, it combines financial and operational tracking. You are not just counting products. You are measuring profit per unit and total inventory value. That gives you better decision-making power.
Second, it uses clear restock logic. The Par Level and Reorder Threshold system ensures you do not run out of high-demand items during peak hours. For small operations, stockouts can mean lost sales that are difficult to recover.
Third, the two-sheet structure keeps everything organized. The main sheet stays focused on daily management, while the Dropdowns sheet ensures clean and consistent data entry.
Fourth, it scales. If your snack bar expands from five products to fifty, the table structure and summary calculations still function the same way. You can add rows without breaking formulas.
Finally, it remains simple. There are no unnecessary macros or overly complex dashboards. Everything updates using standard spreadsheet formulas, which makes it easy to customize in Google Sheets.
If you are building or improving your snack bar operation, this template provides a practical system you can rely on every day. It keeps your stock organized, your margins visible, and your reorder process predictable.
Download Your Free Snack Bar Inventory Spreadsheet
- Free Template
- Fully Editable
- Instant Access
- Organize your information
How to Access Your Copy
- Enter your email for instant access
- Open the link we send you
- Start using the spreadsheet right away