If you invest in dividend-paying stocks or ETFs, staying on top of your income is key to understanding how your portfolio performs. This free dividend tracker spreadsheet for Google Sheets helps you monitor your payouts, yields, and total income throughout the year. Whether you’re building passive income or tracking a dividend reinvestment strategy, this tool makes it simple to see how your money is working for you.
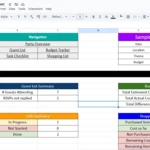
Why Use a Dividend Tracker Spreadsheet
Investors often overlook how much income their holdings actually generate. A dividend tracker spreadsheet consolidates all your payouts in one place and calculates your yield and totals automatically. This allows you to measure portfolio performance beyond just price appreciation. The tracker includes dynamic formulas that compute each stock’s dividend yield and payout amount, so you can see at a glance how much income each position contributes to your total. You can also sort and filter by payment date, frequency, or company to analyze trends in your dividend income over time.
Using a Google Sheets-based dividend tracker means your data is always accessible, easy to update, and shareable. It’s perfect for investors who want a professional-looking dashboard without needing expensive software or complex setups.
What’s Included in the Dividend Tracker Spreadsheet
The spreadsheet consists of two main sections—Dividend Tracker and Monthly Summary—along with a summary of your overall metrics. Here’s what each part does:
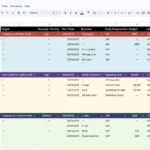
1. Dividend Tracker Sheet:
This is the heart of your spreadsheet. It’s where you record every dividend payment you expect or receive. Each row includes columns for:
-
Date of entry
-
Ticker and company name
-
Shares owned
-
Price per share
-
Dividend per share
-
Automatically calculated Dividend Yield (%)
-
Automatically calculated Payout ($)
-
Ex-Dividend Date and Payment Date
-
Frequency (Quarterly or Monthly)
-
Notes for comments such as “Dividend growth stock” or “Quarterly payout”
In your example, the tracker includes holdings like Apple (AAPL), Coca-Cola (KO), Johnson & Johnson (JNJ), and the Global X NASDAQ 100 Covered Call ETF (QYLD). The sheet calculates each payout (for example, $12.50 from Apple and $46.00 from Coca-Cola) and displays total income at the bottom. This makes it easy to see both individual and total earnings without any manual math.
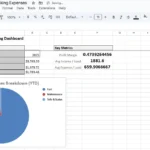
2. Overall Summary Section:
At the top of the Summary sheet, you’ll find metrics such as:
-
Total Annual Dividends ($): The total of all payouts combined across all stocks.
-
Average Dividend Yield (%): The mean yield across your portfolio.
In your sample data, the spreadsheet calculates a total annual dividend of $108.64 and an average yield of 0.72%, showing how even small payouts can add up over time.
3. Monthly Summary Table:
This section automatically groups dividends by payment month using formulas tied to the Payment Date column. It shows month-by-month income totals so you can visualize when most of your dividends arrive. In your updated sheet, the table includes rows for each month (January through December 2025) and displays monthly totals such as:
-
February: $12.50
-
March: $46.00
-
May: $47.60
-
August: $0.84
-
September: $1.70
This gives you a clear picture of your annual income cycle, helping you identify months with heavier or lighter payouts. The table also includes a Year Total row that automatically sums all monthly values.
How to Use the Dividend Tracker Spreadsheet
-
Open and Copy the Sheet
Click the “Make a copy” option in Google Sheets to save it to your account. This ensures you can edit and customize your own version. -
Enter Your Dividend Information
In the Dividend Tracker tab, list each dividend-paying stock or ETF you hold. Enter the ticker, number of shares, and dividend per share. The yield and payout columns will calculate automatically. -
Add Ex-Dividend and Payment Dates
These fields are optional but essential for the Monthly Summary to work correctly. Payment dates drive the monthly income totals. -
Customize the Frequency and Notes Columns
Indicate whether each holding pays quarterly or monthly and include notes about dividend growth, payment patterns, or special distributions. -
View Your Summary and Monthly Totals
Switch to the Summary tab to view your total dividends, average yield, and monthly breakdown. The sheet updates automatically as you add or edit entries.
Advanced Tips and Customizations
-
Add a Chart: Create a line or column chart from your Monthly Summary to visualize your dividend growth over time.
-
Include More Metrics: Add formulas for total portfolio value, payout ratio, or yield on cost if you track purchase prices.
-
Expand the Table: Include ETFs, REITs, or international dividend stocks to get a complete view of your passive income streams.
-
Use Conditional Formatting: Highlight high-yield stocks or those exceeding certain payout thresholds.
-
Automate Data Imports: If you’re experienced with Google Sheets scripting, link your broker exports or use APIs to refresh data automatically.
Who This Spreadsheet Is For
This dividend tracker spreadsheet is ideal for:
-
Long-term investors focused on dividend growth
-
Portfolio managers tracking recurring income streams
-
New investors learning to manage dividend reinvestments
-
Anyone wanting a simple but powerful view of dividend income performance
Whether you hold just a few blue-chip stocks or a diverse ETF portfolio, the tracker adapts to your data and scales easily as your investments grow.
Benefits of Tracking Your Dividends
Tracking your dividends helps reveal how your investments perform beyond market price changes. It provides insights into cash flow stability, income diversification, and reinvestment opportunities. Over time, your spreadsheet becomes a historical record of your passive income growth—showing when and how your payouts increase.
A dividend tracker spreadsheet also helps you plan cash flow, forecast future income, and evaluate the impact of adding new holdings to your portfolio. With automatic yield and payout calculations, you spend less time calculating and more time analyzing.
Conclusion
A clear view of your dividend income can transform how you manage your portfolio. This free dividend tracker spreadsheet for Google Sheets gives you structure, automation, and insight—all in one tool. It’s easy to use, visually organized, and designed for investors who want to stay informed about their passive income performance.
Get your copy now, customize it with your holdings, and start tracking your dividends today. Over time, you’ll see exactly how your portfolio’s income grows—and how your investments help build lasting financial freedom.